Let me bring this discussion back to share that @ivanpribec has replaced the dot_product in the polynomial evaluation function with a Horner loop, and the new implementation is now almost twice as fast as the intrinsic function! This is an unexpected plot twist, excellent work Ivan! Here are the results on my M1 Mac:
federico@Federicos-MacBook-Pro fortran-bessels % ./bessels_test.exe
INTRINSIC time used:   46.9030 ns/eval, sum(z)=-88.451782122026188
PACKAGE   time used:   26.3650 ns/eval, sum(z)=-88.451782121434462
[bessels] 3 test completed: 3 passed, 0 failed.
STOP 0
For the records, I’ve just finished the implementation of besselj1(x) and it also look promising, with approximately ~2x speed-up on the M1:
[bessel_j0] INTRINSIC time used:   45.9751 ns/eval, sum(z)=99.706555563648948
[bessel_j0] PACKAGE   time used:   26.3218 ns/eval, sum(z)=99.706555564603875
[bessel_j1] INTRINSIC time used:   45.6402 ns/eval, sum(z)=48.275497720728119
[bessel_j1] PACKAGE   time used:   26.2781 ns/eval, sum(z)=48.275497722514878
I think I’ve gotten to the point people were talking about when a ~100x speed-up achievement was brought up. With my latest implementation of I0(x), I1(x), K0(x), K1(x), where a Fortran standard version is not available, the current implementation really is up to >100x faster than a reference implementation from the netlib:
[bessel_k0] NETLIB    time used:   50.7966 ns/eval, sum(z)=152003.48979146607
[bessel_k0] PACKAGE   time used:    5.9995 ns/eval, sum(z)=152003.48979146607
[bessel_k1] NETLIB    time used:   31.8502 ns/eval, sum(z)=27011.085779998772
[bessel_k1] PACKAGE   time used:    5.9887 ns/eval, sum(z)=173714.70475950497
[bessel_i0] NETLIB    time used: 1729.0142 ns/eval, sum(z)=0.10292708849736258E+264
[bessel_i0] PACKAGE   time used:   11.0356 ns/eval, sum(z)=0.10292708849736258E+264
[bessel_i1] NETLIB    time used:  332.6255 ns/eval, sum(z)=0.10805437774341595E+48
[bessel_i1] PACKAGE   time used:   11.0384 ns/eval, sum(z)=0.10750715731528420E+48
Is this the latest implementation: add `besselk0`, `besselk1` · perazz/fortran-bessels@111642b · GitHub, that already seems quite optimized. To speed it up further, one can work on the argument reduction, and/or change the polynomials, possibly use just a polynomial, no division. But all the “easy” speedups seems to have been done.
It is. I’ve tried to replace some Horner loops with a manually unrolled version, but that has no practical effect and, tbh, it’s probably better to leave it as a loop and let the compiler decide what to do based on the cpu flags
You can read these two blog posts where we nailed the “sin(x)” implementation using similar techniques that you use. On one computer it is 30x faster than the libc’s sin(x) function, on another computer only 7x faster. Still, huge speedup!
In short, you need to write the function in such a way so that the compiler can efficiently vectorize it when applied to a large vector. It’s a lot of work, you have to setup benchmarking suite, compute theoretical performance peak, reason about the code, and then try various things. See the two blog posts where we have done exactly this for sin(x) and prove that we are pretty much within a factor of 2x from the best possible speed that anyone can ever get on the given CPU I was using.
A very smart thing I believe most compilers do is to return both sin and cos with 1 call only when both are requested; the smart move is that if you have a polynomial expansion for the first one, a shifted query (sin(x+pi/2)) or just the polynomial n-1 derivative gives you the latter in virtually no more cpu operations
Can somebody explain to me how the values of the histogram in this post above have been computed?
If I understand it correctly, from a sample of 1 million values, every single one of them (except maybe a few hundreds for the case of Fortran) is below 1 eps? I assume eps here is 2^(-23) / 2^(-52) for 32/64-bit precision.
I’m asking because I just did a quick check in a small sample of 5000 values and the number of computed values with an error above 1 eps is much higher than the one shown in the histogram. I tested both the intrinsic (from gfortran) and the ported library announced in this thread. So I just want to know what I am doing wrong in the error computation.
I’m not trying to criticize the implementation in itself, I am aware it is not easy to provide such a high accuracy for these types of functions; I am implementing some non-trivial functions myself and getting around 1 eps everywhere is definitely taking some time.
PS: Offtopic, but I had to truncate lines 180-196 in the constants module in order to compile. Is the line-length limit 132 characters? Or was that me with too-strict flags?
I’m porting the library to Fortran but I’m not the one who ran those tests - I clicked on the link and it goes to this post in the forum, apparently the “error” is comparing Bessels.jl against another Julia library.
IMHO this type of tests should be run against an analytical solution, but of course we’re all lazy and end up comparing against just another library. In the post it looks like it’s a quad-precision library, so probably not bad?
You’re fine, so far the Fortran part is just a port, i.e., no attempts at changing the accuracy of the original library. If you could contribute your test case either here or on the github page, it would be a nice addition.
Right, the original Julia library has insanely long lines and some parts haven’t been fully refactored yet - as you see on the page you need to run with -ffree-line-length-none with gfortran, or equivalent commands from other compilers
Oh, I saw the other post but missed the (click to expand). So according to the code, it is just (y_comp - y_exact) / eps(). That’s one of the things I tried, I still get worse errors.
The other library is Arb; it’s a multiprecision library, and from the code it seems to be set to a precision of 500. I’ve used it, I will take those values as ‘exact’. I was also comparing against an ‘eact’ value, so that should not be the problem.
so far the Fortran part is just a port, i.e., no attempts at changing the accuracy
It’s a different compiler, but I assume it should give pretty much the same accuracy as the Julia version.
… you need to run with -ffree-line-length-none with gfortran
What’s the extent of the errors you get? Like, close to 2*eps, 10*eps, 100*eps ?
Below 10, in the range 1 - 5 usually.
But I think I found the mistake(s) in my computations.
I will test things once again and come back when done. This may even be favorable for the functions I was implementing and couldn’t get under 1 eps.
OK thank you,
so still acceptable for a “fast-but-approximate” library. The reason I’m asking is that this started off as a side hustle, and I dropped the effort soon after I realized it wasn’t so much faster than the compiler intrinsics. However, with some optimizations on the code side, and especially for some of the less trivial functions, some speed-ups are dramatic, so I’m trying to pull more work on this and get soon to a full working port
This is a test of the total error, not the relative error. That kind of test would be meaningless in some contexts, e.g. where some number of correct significant digits is required for small function values such as near a root, or in the asymptotic regions of the function tails.
This is just a 10k sample, but serves the purpose. The y axis is cropped, since the point here was to see the width at the base. The x-axis are eps.
This is a test of the total error, not the relative error
Indeed, I was using relative errors in my code, and I was getting larger errors.The bessel functions in such case don’t do well given the large number of zeros.
Sorry I’m dumb. No intent to criticize, just to understand. Could you explain better what’s in the two plots? my understanding:
1st plot: relative errors for 10k randomly sampled bessel calculations
x axis = relative errors (x eps)
y axis = counts
2nd plot: absolute errors for the same random sample
x axis = absolute error (how do we know what was the unknown variable range? x in [-1,1], [-1000000,1000000], etc. Given the above, I guess absolute error 2000 is for a case where abs(besselXYZ(x))>2e+18
y axis = counts
Correct? Still unknown:
which bessel function?
which x range?
I think that because the Julia Bessel package (and its Fortran copy) uses different polynomials per different x ranges, it’s possible that errors round up slightly differently in them, and/or that some of their coefficients don’t have the same confidence
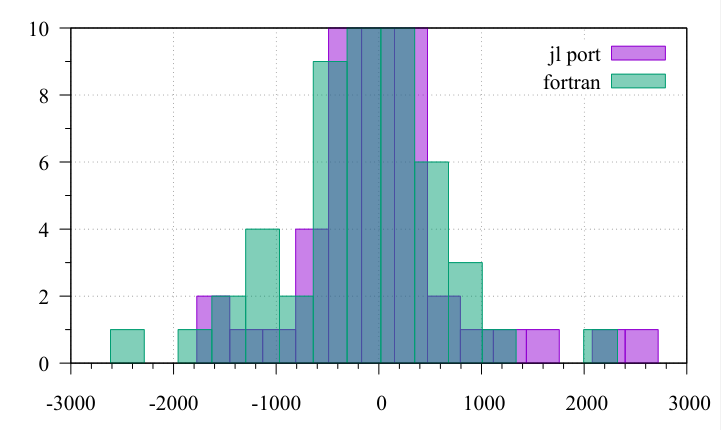
The first plot is absolute error, (y_comp - y_exact) / eps(). The yaxis is indeed the count. It represents the same data as the plot in the post above. But with only 50k samples (I said 10k, my bad), instead of 1 million.
The second plot is the relative error, (1 - y_comp / y_exact) / eps(). y axis is count, and 50k samples as well.
The range is [0, 200], for the function besselj1 / bessel_j1. This did not change, since I wanted to compare with the previous post.
To give one example of where those large (> 1000) values come from: for x = 2452/125 = 19.616:
computed value of besselj1 (julia port) is 2.5476990696321452e-5
computed value of bessel_j1 (intrinsic) is 2.5476990696502314e-5
exact value is -------------------------------------2.5476990696874161191178...e-5.
The relative errors, (1-comp/exact) are of order 1e-11, hence why error/eps is a few thousands.
This is a cherrypicked value (though it was part of the 50k sample), but it’s not hard to find many such. Why is that? As @RonShepard mentioned, values near a root. In this case, x = 19.6158... is a root of bessel_j1.
The histograms are made to show the width, and may make it seem worse than it is. If the vertical axis was not cropped, you’d see a long bar that goes beyond 49k centered at zero. In other words, the computed values are pretty good most of the time. But the bessel functions have many zeros, so large errors are bound to happen.
No, it’s the fortran-bessel port (the one you wrote) against the intrinsic (in gfortran, I haven’t tested any other compiler/math library).
I’m assuming the pure Julia Bessel.jl against the (your) port would give very much the same results, despite being different compilers, unless some flags for aggressive math optimizations are used.
In fact, the first histogram here (using your port) and the one here (pure Julia) are somewhat similar.
EDIT: I will change the legends in the histograms for clarity.
May I ask, I believe I’ve read some messages from you mentioning work on functions approximation i.e. computing the numerical value of transcendental functions. I also saw you made some contributions to the FreeBSD libmath (or maybe someone with a very similar name?).
Do you have any resources on that topic? Some books, papers, code I could look into?
I know about e.g. minimax approximations, but things don’t seem to be as simple as just computing the (rational) approximation in an interval.