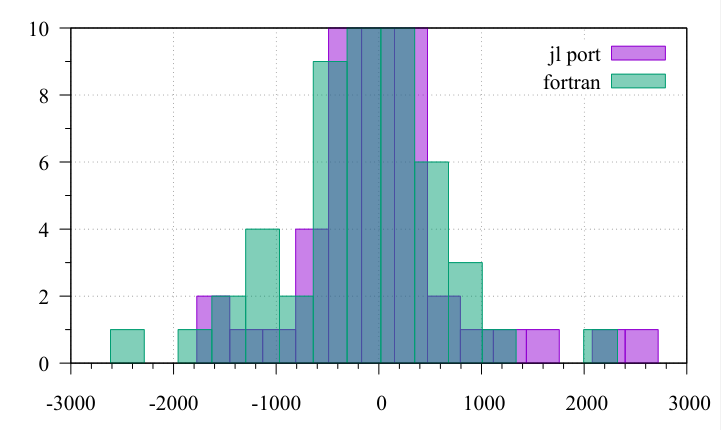
I forgot to update. I end up getting a plot similar to the one above:

This is just a 10k sample, but serves the purpose. The y axis is cropped, since the point here was to see the width at the base. The x-axis are eps.
This is a test of the total error, not the relative error
Indeed, I was using relative errors in my code, and I was getting larger errors.The bessel functions in such case don’t do well given the large number of zeros.