I just created the project fpm-modules, a fpm plugin to generate module dependency graphs. Since it took me some time and research to create it, I wrote a tutorial out of it, hoping it could be useful for anyone else willing to try to use the fpm api. Any comments about this tutorial are more than welcome.
Introduction
Ever tried to untangle a complex Fortran project? It’s like navigating a maze without a map. Dependency charts can be a lifesaver, showing how modules and source files connect, making refactoring or debugging much easier. The Fortran Package Manager (fpm) is a modern tool that simplifies Fortran development, similar to how Cargo powers Rust. Beyond building projects, fpm’s API lets you create custom plugins, like one for generating interactive module dependency charts.
Inspired by a Fortran community discussion, I discovered fpm’s ability to dump a project’s structure into a JSON or TOML file. This “build model” contains all the info needed to analyze dependencies programmatically. While you could parse this file manually, fpm’s API makes it easier by letting you work directly with the model in Fortran. In this tutorial, we’ll build a plugin to create a visual dependency chart using Mermaid, a JavaScript-based diagramming tool. Whether you’re refactoring legacy code or starting fresh, this tool will help you see the big picture.
The complete code is available on GitHub.
Why Module Dependency Charts?
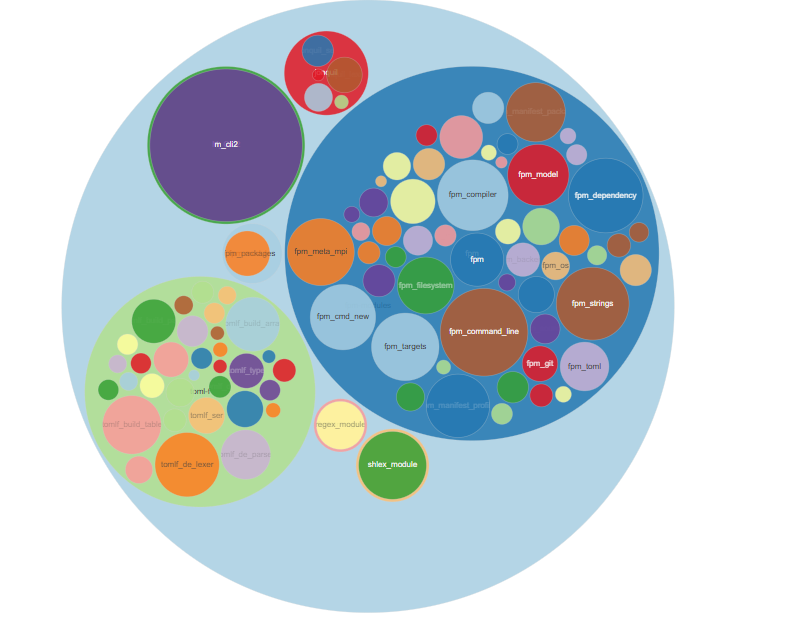
Modern Fortran projects rely heavily on modules, but tools like Doxygen are better suited for older Fortran 77 projects, where they generate caller-callee graphs. For example, here’s a Doxygen-generated graph for the daskr project. With the following Doxyfile, it’s relatively easy to generate this kind of graph.
INPUT                  = ./src
HAVE_DOT               = YES
EXTRACT_ALL            = YES
EXTRACT_PRIVATE        = YES
EXTRACT_STATIC         = YES
CALL_GRAPH             = YES
CALLER_GRAPH           = YES
DISABLE_INDEX          = YES
GENERATE_TREEVIEW      = YES
RECURSIVE              = YES
COLLABORATION_GRAPH    = YES
GRAPHICAL_HIERARCHY    = YES
DOT_CLEANUP            = NO
GENERATE_HTML          = YES
GENERATE_LATEX         = NO

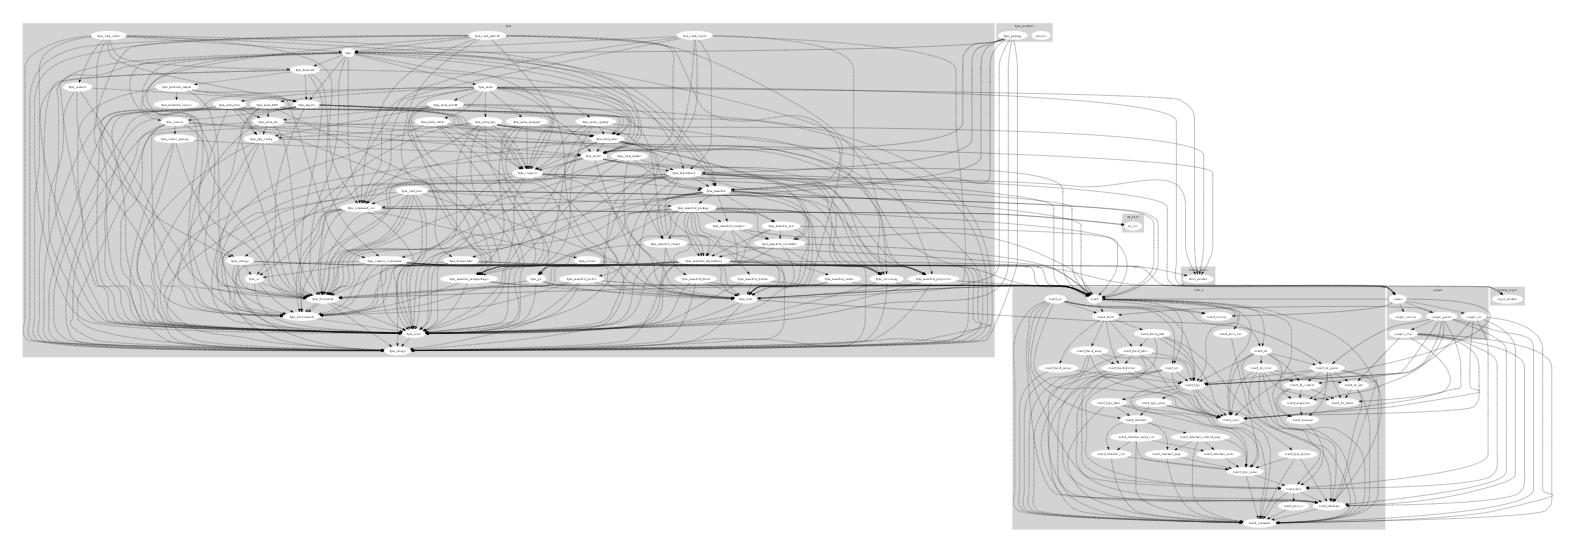
While useful for functional code, Doxygen struggles with module dependencies. Our plugin will use fpm’s API to create a chart like this :

Our goal is to loop through a project’s modules, identify their dependencies, and output an interactive chart using Mermaid. There is already fpm-deps to visualize project dependencies, but nothing for modules.
Understanding fpm’s Role
fpm is more than a build tool—it’s a gateway to modern Fortran development. By parsing your project’s structure, fpm creates a build model that details every module, source file, and dependency. Our plugin will tap into this model to generate a visual dependency chart. Let’s get started!
Setting Up the Project
First, ensure fpm is installed. Then, follow these steps:
-
Create a New Project:
Run this command to generate a project calledfpm-modules:fpm new fpm-modulesThis creates a directory with a
fpm.tomlfile, asrcfolder, and sample code. -
Configure
fpm.toml:
Openfpm.tomland add fpm as a dependency to use its API. Here’s the updated file:name = "fpm-modules" version = "1.0.0" license = "MIT" author = "Your Name" maintainer = "Your Name" copyright = "Copyright 2025, Your Name" description = "Generate dependency graphs of Fortran modules" [build] auto-executables = true auto-tests = true auto-examples = true module-naming = false [install] library = false test = false [fortran] implicit-typing = false implicit-external = false source-form = "free" [dependencies] fpm = { git = "https://github.com/fortran-lang/fpm" }The
[dependencies]section pulls in fpm’s source code, giving us access to its API. -
Set Up the Main Module:
In thesrcfolder, createpackage.f90with the necessary fpm modules:module fpm_package use fpm_strings, only: string_t use fpm_command_line, only: fpm_build_settings, get_command_line_settings, get_fpm_env use fpm_dependency, only: dependency_tree_t, new_dependency_tree use fpm_error, only: error_t, fpm_stop use fpm_filesystem, only: join_path use fpm_manifest, only: package_config_t, get_package_data use fpm, only: build_model implicit none private type, extends(package_config_t), public :: package type(fpm_model_t), public :: model contains procedure, public :: create => package_create end type end module
These modules provide access to fpm’s build model, file system utilities, and error handling. The key components are fpm_model_t (for project configuration) and build_model (for generating the dependency tree).
Exploring fpm’s Build Model
fpm’s build model is a structured representation of your project’s modules, source files, and dependencies. Our plugin will use this model to identify module dependencies and create a chart.
The key component is the fpm_model_t type, which contains a nested model object. Here’s a simplified view:
fpm_model_t
          |- external_modules(:)
          |- packages(:)
                               |- name
                               |- sources(:)
                                          |- modules_provided(:)
                                          |- module_used(:)
- external_modules: External modules (e.g.,
ifcorefrom Intel oropenmp) linked to the project but not in the source code. - packages: Project packages, each containing:
- name: The package name.
- sources: Source files, each with:
- modules_provided: Modules defined in the file (e.g.,
module math_utils). - module_used: Modules imported via
usestatements (e.g.,use string_utils).
- modules_provided: Modules defined in the file (e.g.,
For example, if your project has a file math.f90:
module math_utils
    use string_utils
    implicit none
end module
The build model lists math_utils under modules_provided and string_utils under module_used.
Note: fpm organizes its model by source files, not individual modules. If a file contains multiple modules, fpm associates all
module_usedentries with the file. Our plugin will link dependencies to the first module in a file to simplify the chart.
Building the Dependency Model
We’ll use the build_model subroutine to create the model. It requires a fpm_build_settings object, which we’ll configure with minimal settings since we’re only generating the model, not compiling the project.
Here’s the code:
subroutine package_create(this)
    class(package), intent(inout) :: this
    type(fpm_build_settings) :: settings
    type(error_t), allocatable :: error

    ! Configure build settings (most are irrelevant for model generation)
    settings = fpm_build_settings( &
        & profile=" ", & ! No specific build profile
        & dump="fpm_model.toml", & ! Output model file (optional)
        & prune=.false., & ! Don’t prune unused dependencies
        & compiler=get_fpm_env("FC", "gfortran"), & ! Default Fortran compiler
        & c_compiler=get_fpm_env("CC", " "), & ! No C compiler needed
        & cxx_compiler=get_fpm_env("CXX", " "), & ! No C++ compiler needed
        & archiver=get_fpm_env("AR", " "), & ! No archiver needed
        & path_to_config=" ", & ! No config file needed
        & flag=" ", & ! No Fortran flags
        & cflag=" ", & ! No C flags
        & cxxflag=" ", & ! No C++ flags
        & ldflag=" ", & ! No linker flags
        & list=.false., & ! Don’t list files
        & show_model=.false., & ! Don’t display model
        & build_tests=.false., & ! Exclude tests
        & verbose=.false.) ! Minimal output

    ! Build the model
    call build_model(this%model, settings, this%package_config_t, error)
    if (allocated(error)) then
        call fpm_stop(1, '*package_create* Model error: '//error%message)
    end if
end subroutine
Generating the Dependency Chart
We’ll generate an HTML file with Mermaid syntax to create an interactive flowchart. The chart includes subgraphs for each package and edges for module dependencies, rendered with Mermaid and Panzoom for interactivity.
Here’s the code:
subroutine generate_chart(this, filepath)
    class(package), intent(inout) :: this
    character(len=*), intent(in) :: filepath
    integer :: unit, i, j, k, l

    ! Open HTML file for the Mermaid chart
    open(newunit=unit, file=filepath, action='write', status='replace')

    ! Write HTML and Mermaid header
    write(unit, '(*(A,/))') &
        '<!DOCTYPE html>', &
        '<html lang="en">', &
        '<head>', &
        '    <meta charset="utf-8">', &
        '</head>', &
        '<body>', &
        '    <div class="diagram-container" id="diagram-container">', &
        '        <pre class="mermaid">', &
        '        flowchart LR'

    ! Create subgraphs for each package
    do i = 1, size(this%model%packages)
        write(unit, '("      subgraph package_", A)') this%model%packages(i)%name
        do j = 1, size(this%model%packages(i)%sources)
            do k = 1, size(this%model%packages(i)%sources(j)%modules_provided)
                write(unit, '("          ", A)') this%model%packages(i)%sources(j)%modules_provided(k)%s
            end do
        end do
        write(unit, '(A)') '      end'
    end do

    ! Create a subgraph for external modules
    write(unit, '("      subgraph external_module")')
    do j = 1, size(this%model%external_modules)
        write(unit, '("          ", A)') this%model%external_modules(j)%s
    end do
    write(unit, '(A)') '      end'

    ! Add edges for module dependencies
    do i = 1, size(this%model%packages)
        do j = 1, size(this%model%packages(i)%sources)
            do k = 1, size(this%model%packages(i)%sources(j)%modules_provided)
                do l = 1, size(this%model%packages(i)%sources(j)%modules_used)
                    write(unit, '("      ", A, "-->", A)') &
                        this%model%packages(i)%sources(j)%modules_provided(k)%s, &
                        this%model%packages(i)%sources(j)%modules_used(l)%s
                end do
                exit ! Link dependencies to the first module in the file
            end do
        end do
    end do

    ! Close Mermaid and HTML, add scripts for rendering
    write(unit, '(*(A,/))') &
        '        </pre>', &
        '    </div>', &
        '<script src="https://cdn.jsdelivr.net/npm/mermaid/dist/mermaid.min.js"></script>', &
        '<script src="https://unpkg.com/@panzoom/panzoom@4.6.0/dist/panzoom.min.js"></script>', &
        '<script>', &
        '    mermaid.initialize({startOnLoad:false, maxEdges: 4000});', &
        '    mermaid.run({', &
        '        querySelector: ".mermaid",', &
        '        postRenderCallback: (id) => {', &
        '            const container = document.getElementById("diagram-container");', &
        '            const svgElement = container.querySelector("svg");', &
        '            const panzoomInstance = Panzoom(svgElement, {', &
        '                maxScale: 5,', &
        '                minScale: 0.5,', &
        '                step: 0.1,', &
        '            });', &
        '            container.addEventListener("wheel", (event) => {', &
        '                panzoomInstance.zoomWithWheel(event);', &
        '            });', &
        '        }', &
        '    });', &
        '</script>', &
        '</body>', &
        '</html>'

    close(unit)
end subroutine
This code:
- Creates an HTML file with Mermaid syntax.
- Defines subgraphs for packages and external modules.
- Adds edges for dependencies (e.g.,
module_a --> module_b). - Includes scripts for interactive rendering.
To view the chart, save the output as chart.html and open it in a browser. Try it with a small project to see the dependencies visualized.
Tip: Paste the Mermaid syntax into mermaid.live to preview the chart instantly.
Testing with a Sample Project
To see the plugin in action, create a small Fortran project with two modules:
! src/string_utils.f90
module string_utils
    implicit none
    ! ... module code ...
end module

! src/math_utils.f90
module math_utils
    use string_utils
    implicit none
    ! ... module code ...
end module
Run the plugin with:
fpm run
This generates chart.html, which you can open to see a chart showing math_utils --> string_utils.
Common Issues and Solutions
- Error: “Model error”: Ensure
fpm.tomlincludes the fpm dependency and your Fortran files are valid. - Chart not rendering: Check that your browser supports JavaScript and the Mermaid CDN is accessible.
- Multiple modules per file: The plugin links dependencies to the first module in a file. If this is an issue, split modules into separate files.
Conclusion and Next Steps
You’ve built a powerful fpm plugin to visualize Fortran module dependencies! This tool makes it easier to understand project structures, saving time during refactoring or debugging. Here are some ways to extend it:
- Try Other Formats: use force-graph for interactive 3D charts.
- Automate with CI/CD: Add chart generation to your CI pipeline for up-to-date documentation.
- Enhance the Chart: Add colors or labels to the Mermaid chart for clarity.
- Contribute: Check the plugin on GitHub.
I hope this tutorial inspires you to explore fpm’s API further. If you create a cool chart, share it with the community—we’d love to see it!