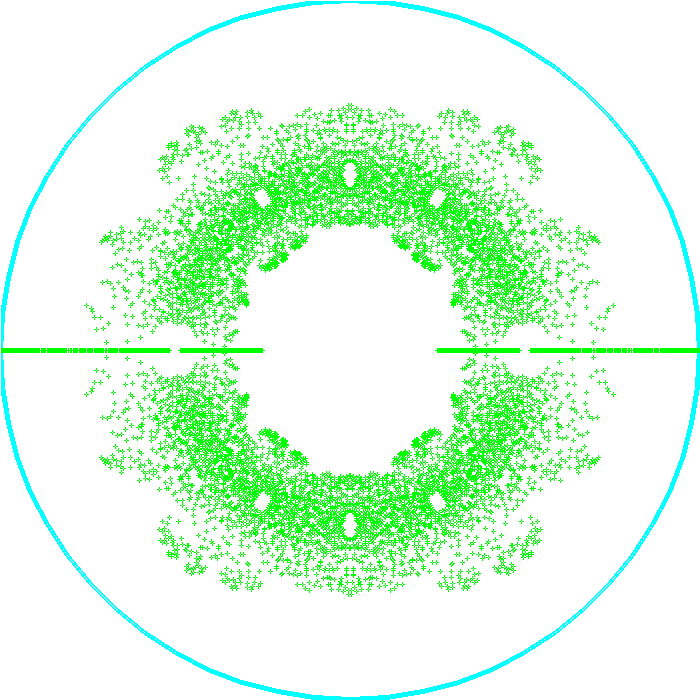
Here’s a little “code golf” exercise. Consider this code:
    program polyroots_test_10

    use polyroots_module, only: dpolz, wp => polyroots_module_rk
    use pyplot_module,    only: pyplot

    implicit none

    integer,parameter :: degree = 10

    real(wp),dimension(degree+1) :: a    !! coefficients of polynomial
    real(wp),dimension(degree) :: zr, zi !! roots
    integer :: ierr,i,j,k,l,m,n,o,p,q,r,s
    type(pyplot) :: plt

    call plt%initialize(grid=.true.,xlabel='$\Re(z)$',ylabel='$\Im(z)$',&
                        title='Degree 10 Polynomial Roots',usetex=.true.,&
                        figsize=[20,10])
    do i = -1, 1, 2
        do j = -1, 1, 2
            do k = -1, 1, 2
                do l = -1, 1, 2
                    do m = -1, 1, 2
                        do n = -1, 1, 2
                            do o = -1, 1, 2
                                do p = -1, 1, 2
                                    do q = -1, 1, 2
                                        do r = -1, 1, 2
                                            do s = -1, 1, 2
                                                a = [i,j,k,l,m,n,o,p,q,r,s]
                                                call dpolz(degree,a,zr,zi,ierr); if (ierr/=0) error stop ierr
                                                call plt%add_plot(zr,zi,label='',linestyle='bo',markersize=1)
                                            end do
                                        end do
                                    end do
                                end do
                            end do
                        end do
                    end do
                end do
            end do
        end do
    end do
    call plt%savefig('roots.png')

    end program polyroots_test_10
The resultant plot can be seen here.
The idea is to get all the combinations where each element of a is either 1 or -1. How can we make this less verbose? Is there an intrinsic way I’m missing, or a library out there somewhere to do this?